The objective of this article is to familiarize you with the Data Knowledge Studio. Why is this function fundamental? How can you use it for your acculturation projects?
What is the Data Knowledge Studio?
One of the main challenges of a data catalog is to be able to easily restore the context of an object or a perimeter of data to the consumers of the knowledge. Thus it is possible for:
- expert users, who produce knowledge, to make complex models easily understandable, by focusing on a specific perimeter.
- business users, who come to consume knowledge, to understand very quickly the main management issues of an object.
However, with the complexity of the data landscape (multiplication of objects and links, non-direct links, etc.), it is difficult to obtain useful and easily understandable information from a list of objects, hierarchical or not. Similarly, graphical representations such as lineages are quickly saturated and do not allow for easy focus on a defined perimeter and/or context. It is necessary to be able to limit the restituted perimeter and if possible to document it. The Data Knowledge studio is an answer to these problems!
The Data Knowledge Studio is a DataGalaxy module offering a wide range of graphical elements to materialize different types of representations in the form of diagrams according to the desired context.
Two types of diagrams are proposed:
- Free diagrams:
They offer a visual interface that allows you to represent all the types of objects in your data catalog and the links that exist between them, regardless of their module. This way it is much more natural to understand the concepts involved in a given functional scope. - Physical diagrams:
Physical model of a relational database. This diagram offers a visual interface to define tables and their columns, and also primary keys, foreign keys, and relations between those tables.
Access to free diagrams
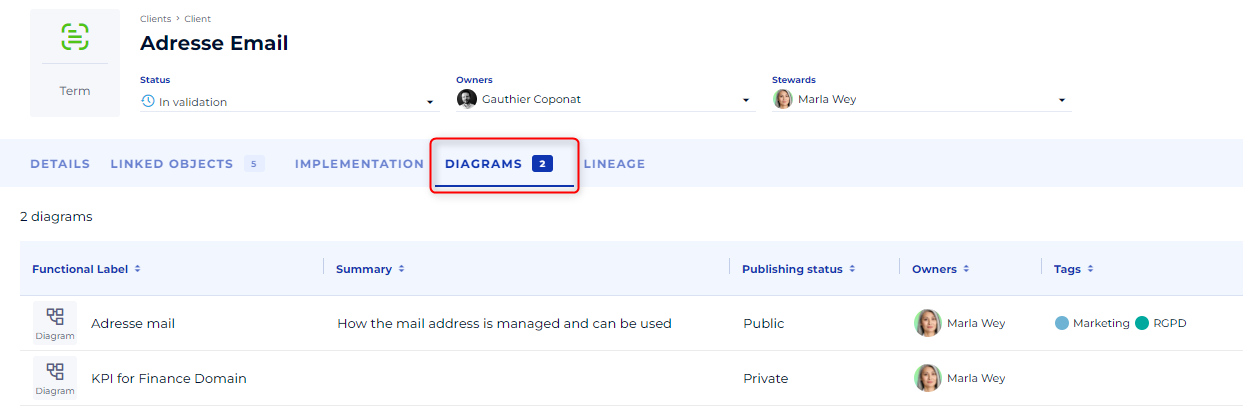
The free diagrams are available for all objects. This is why they are accessible directly on the object's file. It is possible to see each object if it is represented in one or more diagrams and to navigate on them to visualize the representation context in which the object intervenes.
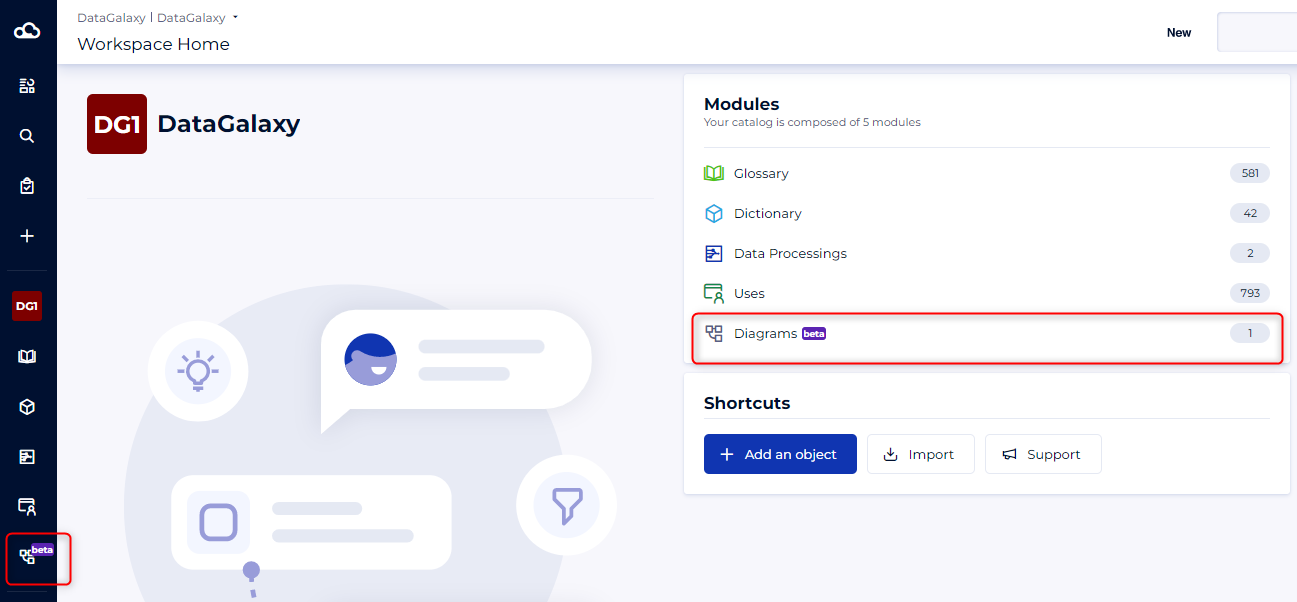
Diagrams are a part of the Data Knowledge Studio. As such it is a module in its own right, which is available at the same level as the 4 historical modules of a workspace. From the workspace home page or from the navigation bar it is possible to access the list of free and physical diagrams.
Manage the free diagrams
Create a diagram
The creation of free diagrams is done only from the dedicated module, by clicking on the "+" button: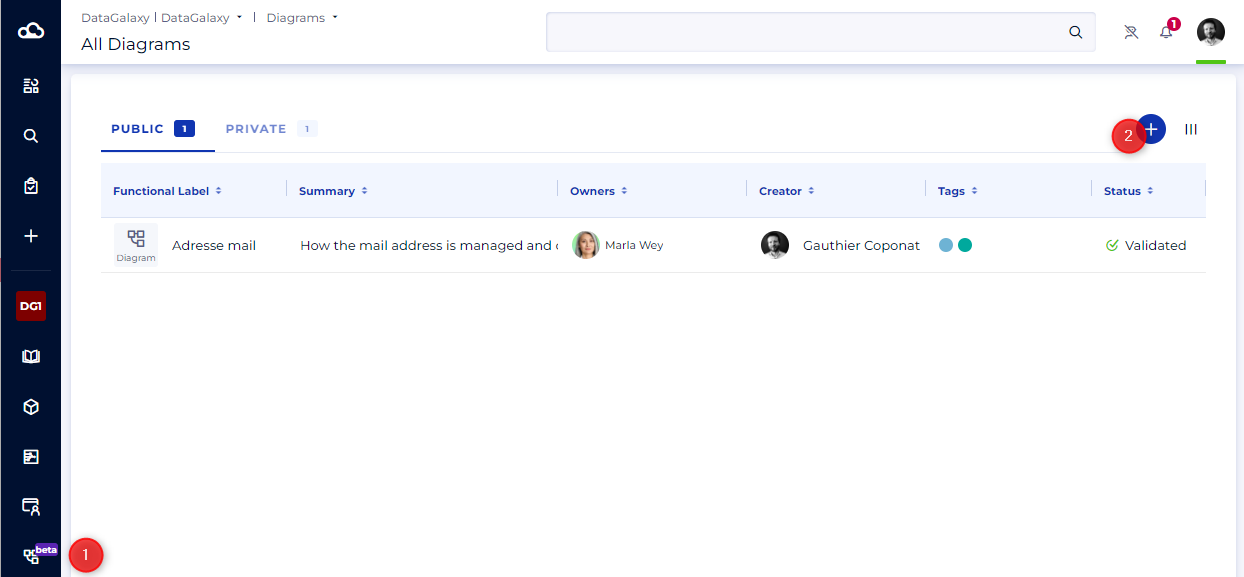
Populate your free diagram
It is possible to use existing objects or to create objects directly in the diagram. ;
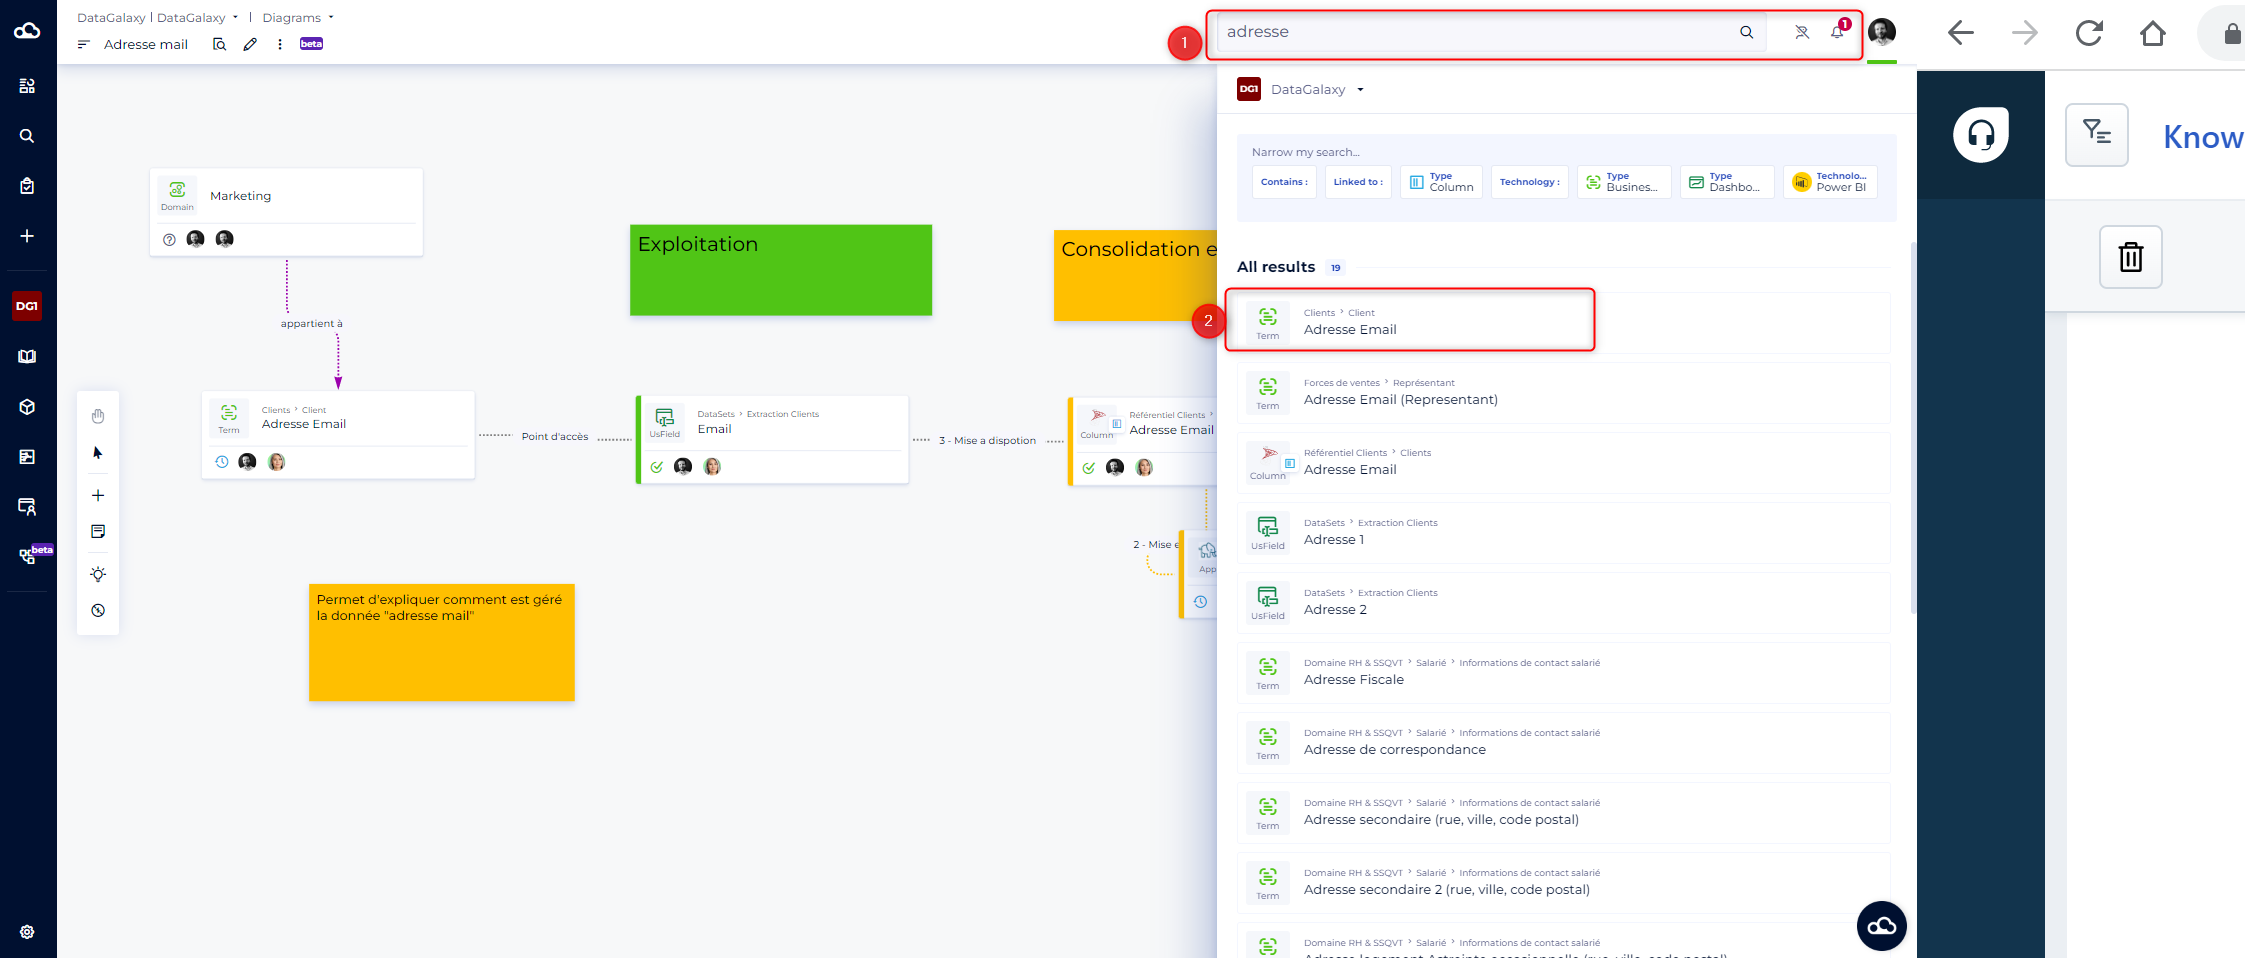
- To use the existing objects you just have to use the search bar: launch the search on a term and make a drag & drop of the desired objects on the drawing area, which we call: the scene..
- To create an object, simply click on the "+" button on the side of the diagram.
Any object created via this procedure is created not only in the diagram but also in the module concerned. As such, only users with write access to the modules have the ability to create objects via the diagrams.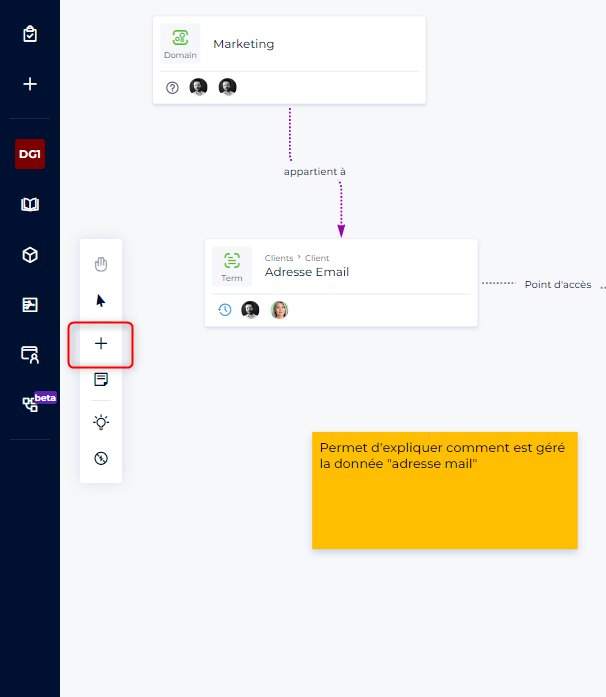
Create links between objects;
The free diagram allows you to create links between objects directly from the interface. To do this, simply hover over the source object. Lateral "handles" appear on either side of the object, which can be clicked and, without letting go, move to the target object, then release the click.
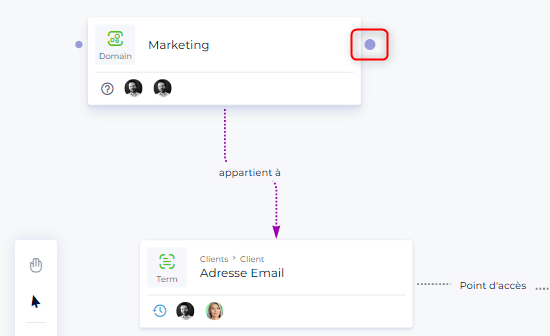
The link created is of type "is linked to".
It is possible, after tracing a link, to modiffy the side of the object to which it is attached.
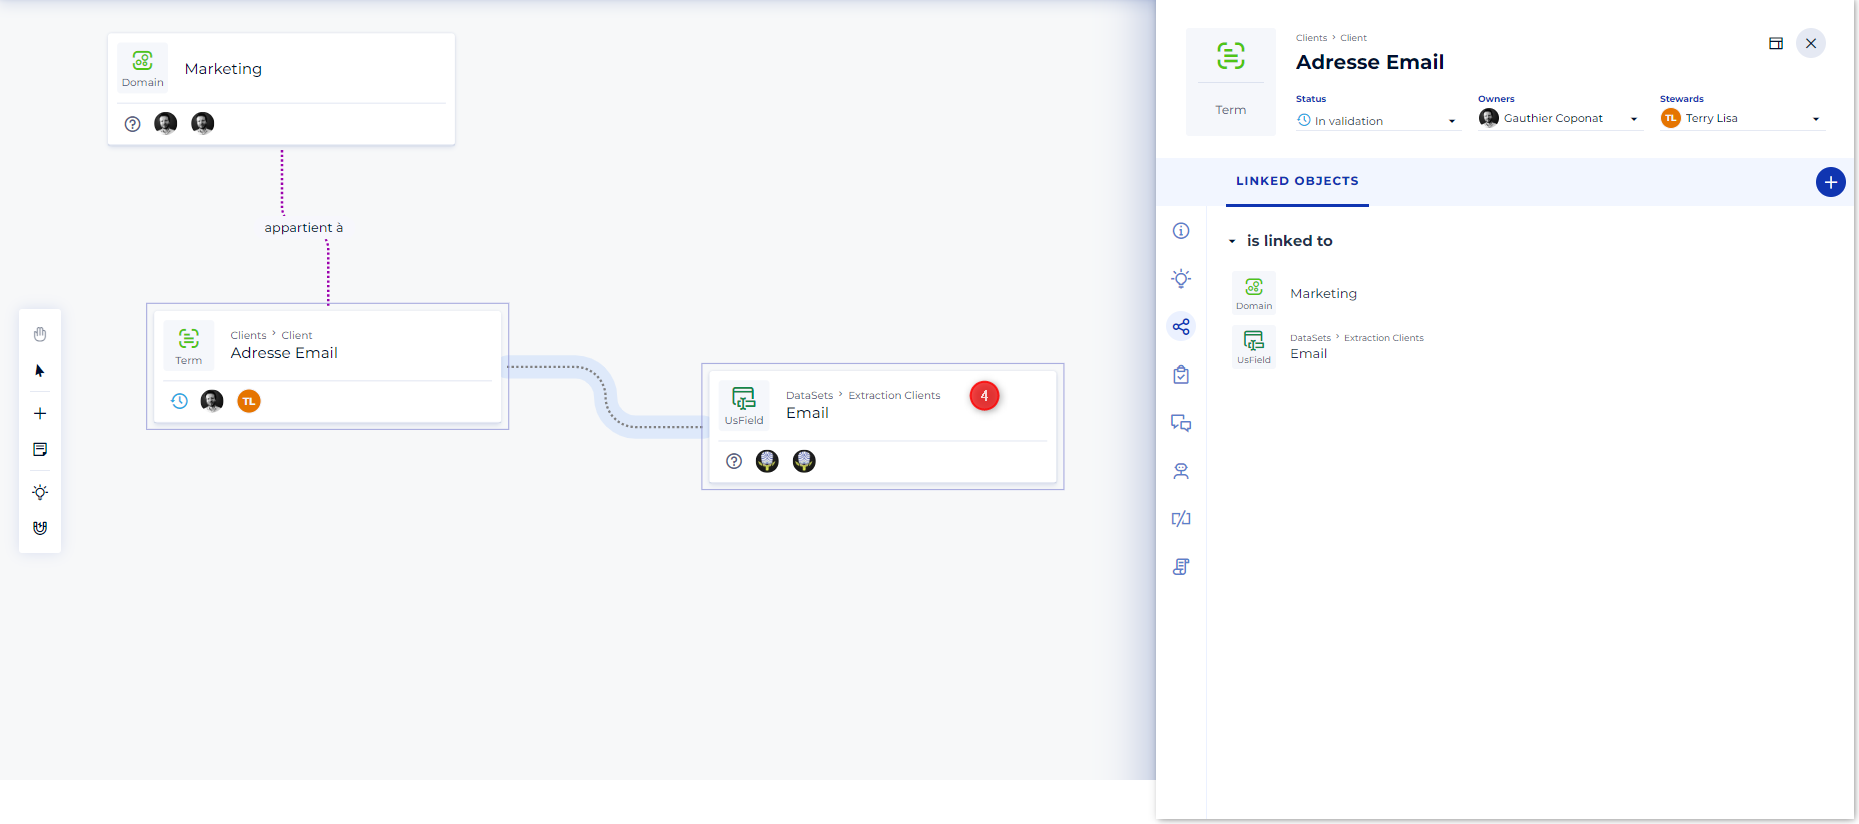
Search and use related objects
The free diagram allows one to quickly find the objects linked to an object present on the scene and to bring them back on the scene via a simple drag&drop
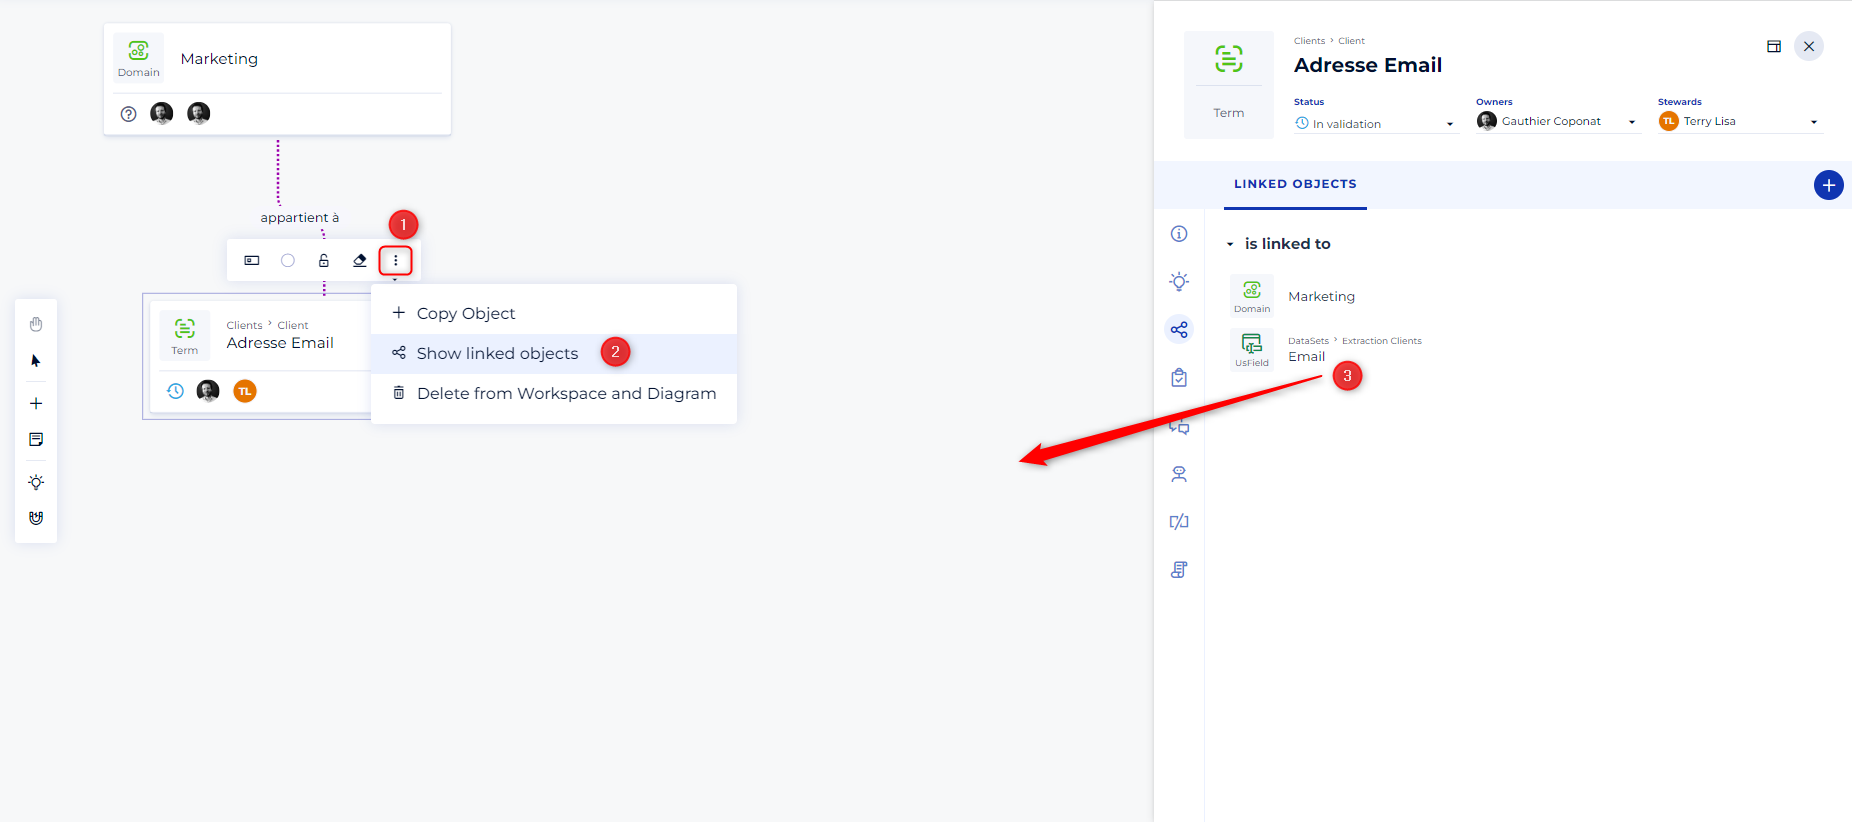
The existing objects and links are then automatically materialized on the scene.
Customize a diagram
One of the strong interests of the diagram is the possibility of customization: colors, the naming of links, display of additional information, reduction of the size of objects
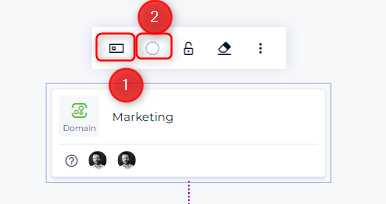
Option 1 allows you to choose the object display type.
Option 2 allows you to choose the object's display color.
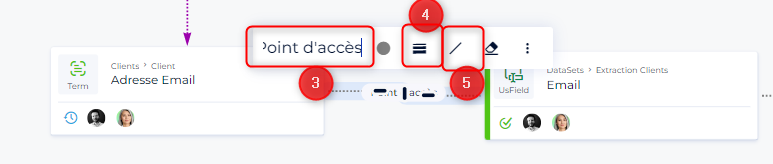
Option 3 allows you to name the link (note that this does not allow you to change the type of link and will only be displayed in the diagram)
Option 4 allows you to choose the type of line and option 5 the type of arrow.
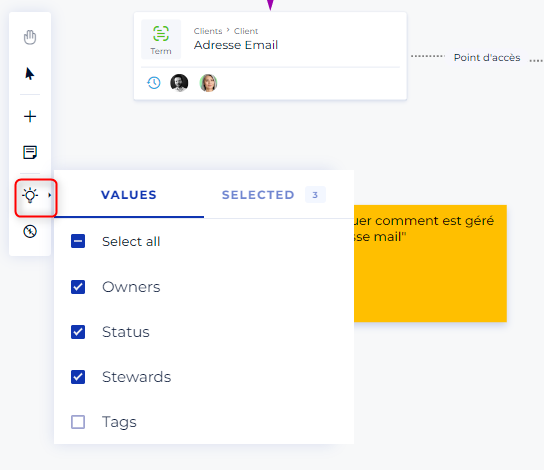
Finally, it is possible to display more information on the objects via the "extra data" option available in the side menu. This information will be displayed on all objects present in the diagram in read-only mode.
Describe a diagram
Free diagrams are considered objects: this means that they can be described by attributes. These attributes are manageable like all the other attributes (so they can be created by the administrator of the client space and configured by the administrator of your workspace). They can be easily displayed by clicking on the magnifying glass in the diagram.
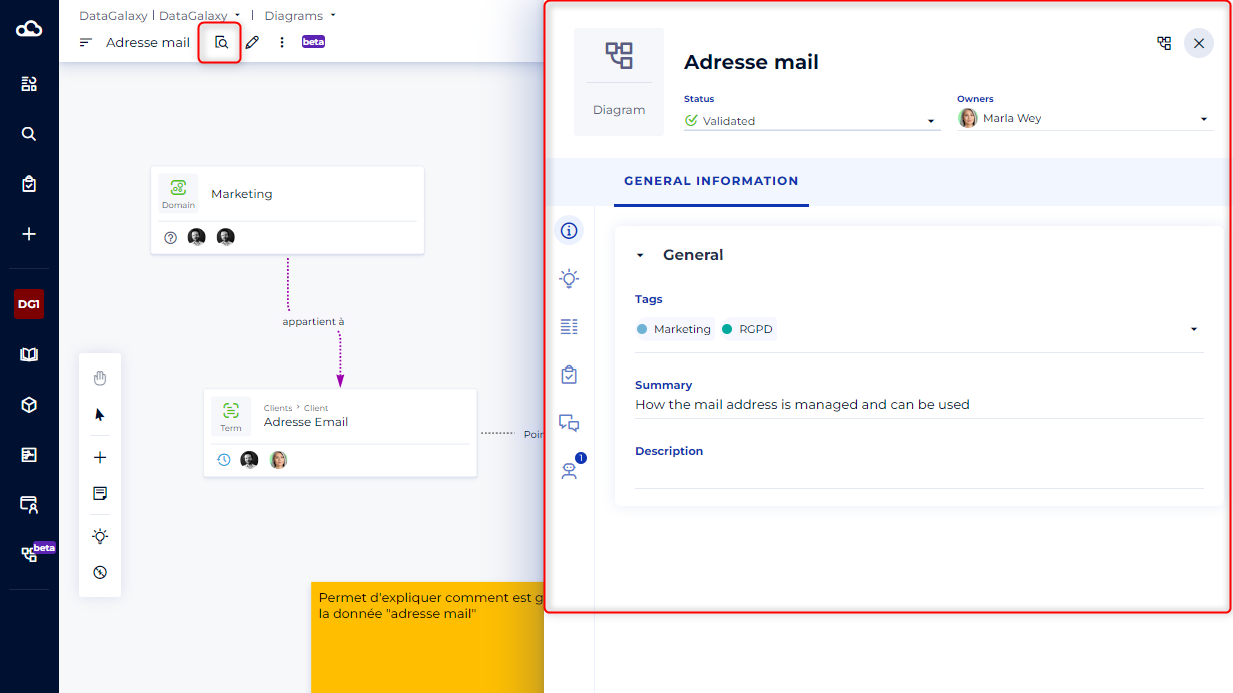
The magnifying glass opens the overview panel of your object where you will find the attributes describing it, but also the list of objects composing it and other functions (insights, tasks, comments, metabot).
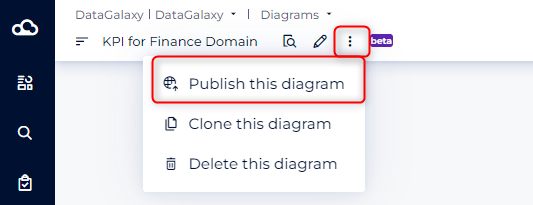
Share the diagram
Sharing diagrams means making them public. They are available to anyone who can access your workspace. This is done via the 3 small dots to the right of your diagram name