When we map the information system we can describe several layers:
- Application Layer: This layer represents the applications that are used in the information system, such as content management systems, customer relationship management (CRM) applications, supply chain management applications, and so on. It can include information about application functions, application interfaces and communication protocols.
- The data layer: This layer represents the data stored in the information system, such as customer data, financial data, production data, etc. It may include information about the databases, the data management systems, and the data processing systems. It can include information about databases, data files, data warehouses and data management services.
- The infrastructure layer: This layer represents the hardware and software components that are required to run the information system, such as servers, computers, networks, storage devices, virtualization software, etc. It may include information about the configurations of the infrastructure and the software used to run it. It can include information about hardware and software configurations, network connections, security protocols, etc.
- The business process layer: This layer represents the business processes and workflows that are supported by the information system. It can include information on activities, roles, responsibilities, business rules, performance indicators, etc.
This recipe addresses the application layer.
How to represent this mapping
The uses module allows to display all the data uses, that's why it contains the "Application" object.
Thanks to this Applications object, you can :
- have a dedicated "object" card to describe the applications
- For reporting type applications, list all the reports
- Be able to link it to
- Data managed by linking it to the glossary
- Its data sources (dictionary module)
- The processings (processing module)
Attention: Applications can be linked to technologies or even store information imported by the connector. In this case, it is not relevant to create an "applications" root level that contains all the applications. Indeed:
- The technology is inherited from the root object: so you could have only one technology for all children
- The connector match information thanks to the path. By adding a root level, the path will be different and so the connector will not be able to match with the application listed in the catalog.
Describing applications
With a dedicated object card, you will be able to have specific attributes. Here is a non-exhaustive list of attributes that can be used to describe an application:
- Description: for this you can use the editor's attributes
- Identification: there is often an internal code to identify applications. An attribute can be dedicated to this.
- Owner
- List of user entities
- Type of technology : rich client, web, etc.
- URL d'accès
- Type of application: internal development, software, package
- Volume of users and profiles: note that for this attribute it may be interesting to use time series attributes in order to measure possible progressions.
Create the application clusters
In order to make it easier for everyone to understand, it is often interesting to create application clusters. For example, by specifying the applications linked to a particular business domain.
As described above, using hierarchies can be detrimental. The best solution is then to use filtered views based on the attributes describing the object records. For example :
- Applications in a given business domain
- Applications containing personal data
- Applications hosted on a particular server
This approach has several other advantages:
- These filtered views are shareable and easily accessible via the search
- They can be set as a default view of the usage module
A second way of working is to use the domain notion to describe your neighborhoods and blocks. You can thus
- Have a dedicated object card to describe it
- Have an object that can be easily called from any DataGalaxy object
- Easily browse the information on the object sheets thanks to the shortcut attributes.
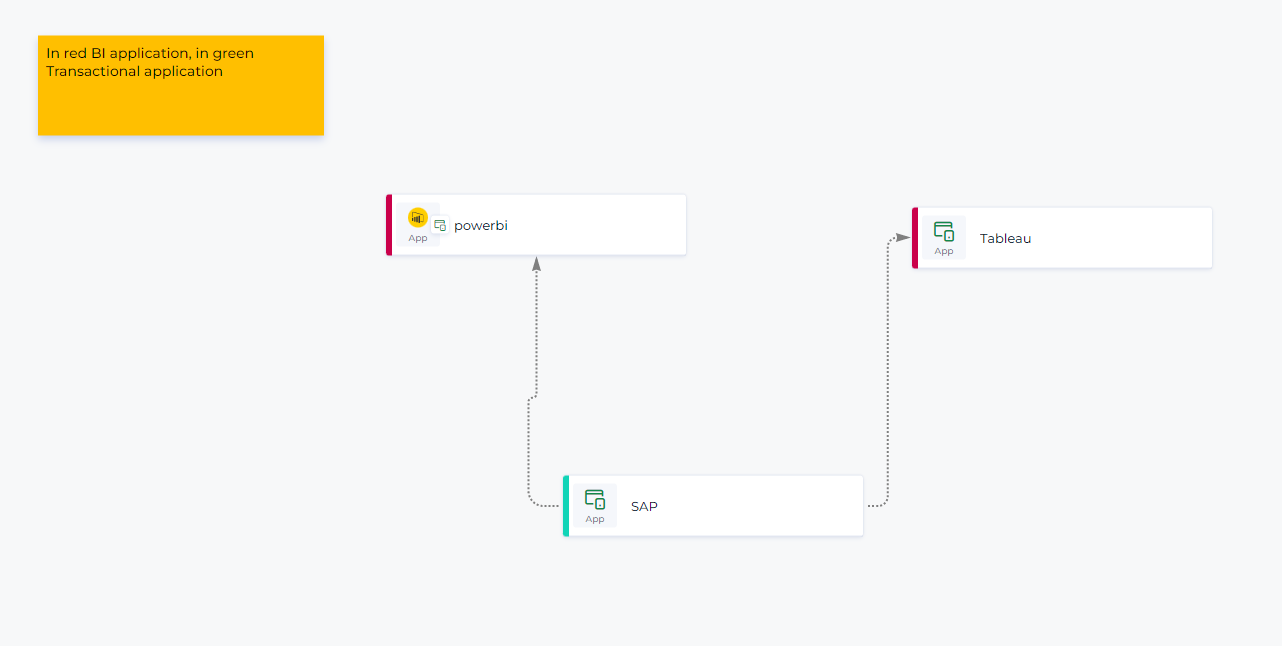
Represent the application clusters
Once the applications have been described in detail, it can be very interesting to represent the links on a free diagram. This way you will have a vision of the different links between your applications. You can also use the available colors to represent the application islands.
Next steps
As we have seen above, an application mapping will make sense in DataGalaxy because it is possible to link it to
- To the business data used
- To possible technical layers: sources and other flows.
To go further, this mapping can of course be linked to business processes. It will be possible to understand when the application is used and in which context.